MBS Benchmark A03: Andrew’s Squeezer Mechanism
Benchmark Objective
The A03 MSB benchmark problem has a very small time scale, thus making it difficult to simulate for solvers that cannot reach small time steps (below 1 ms) [GDLC06].
Benchmark Description
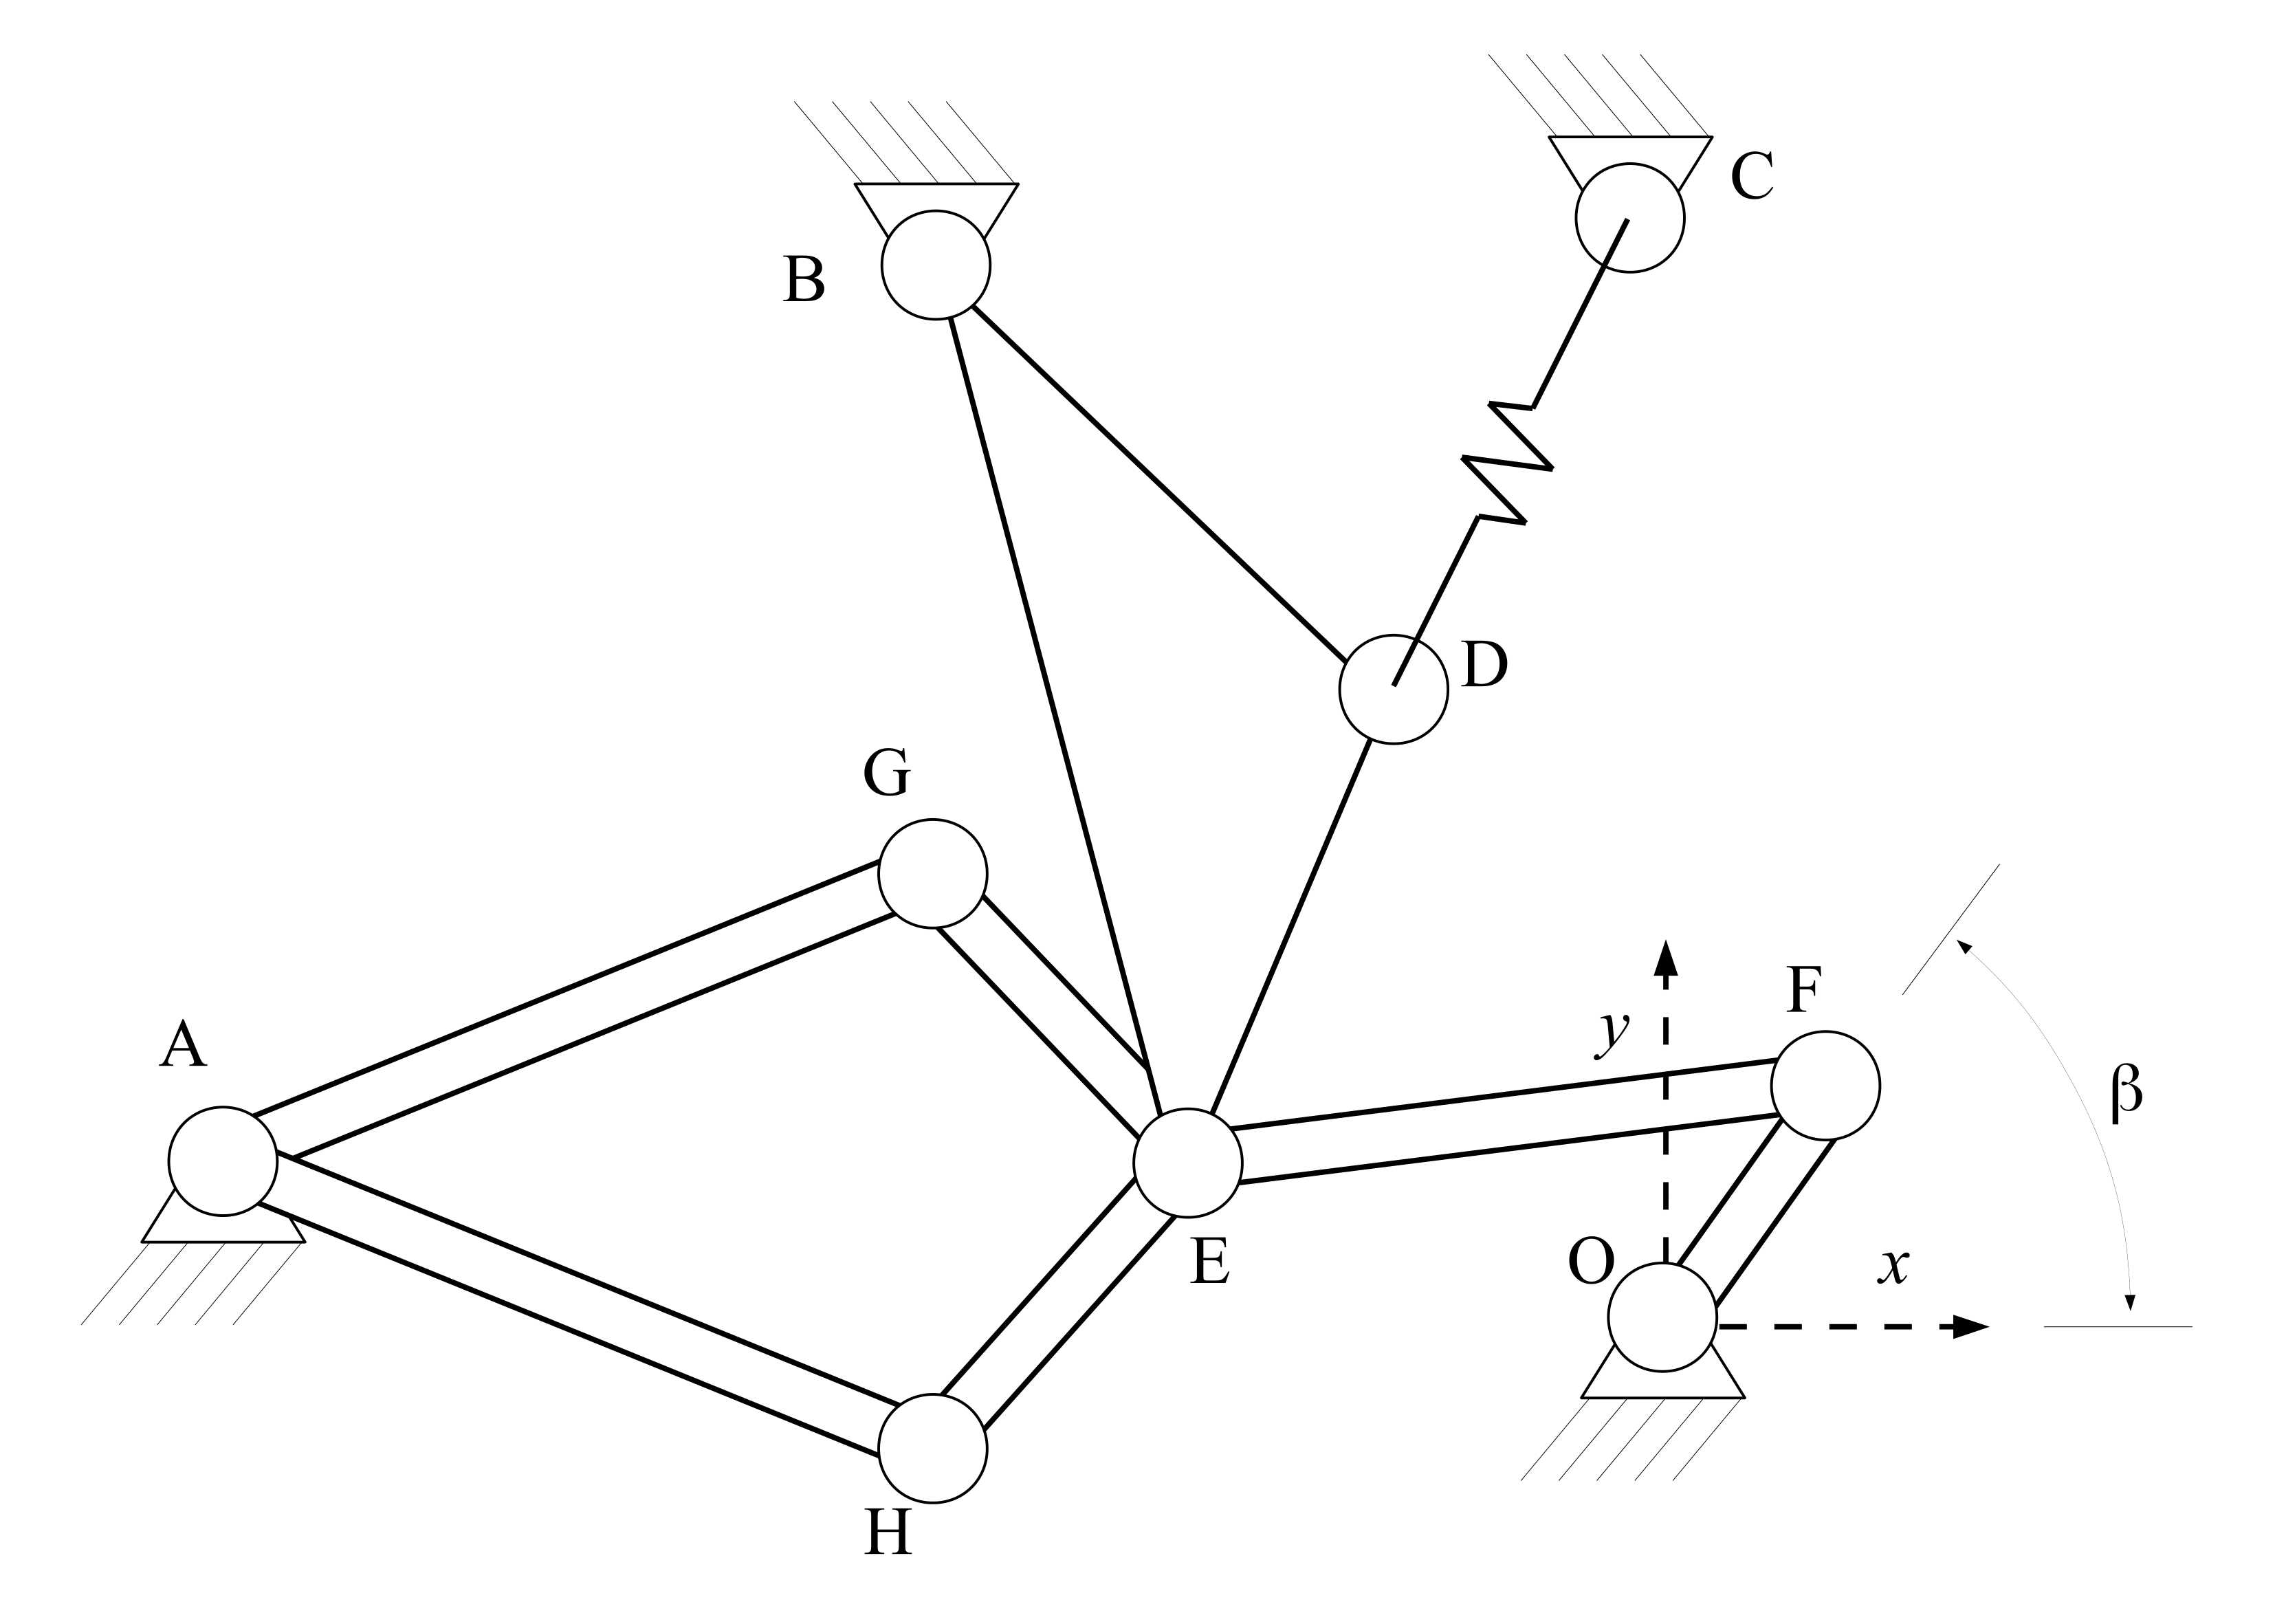
Andrew’s squeezer mechanism [Sch97] is a planar system composed of seven bodies interconnected through revolution joints, and driven by a motor located in O. The next figure presents the sketch of the mechanism.
The following table reports the system configuration.
| System Properties and Configuration | |
|---|---|
| Spring coefficient | 4530 N/m |
| Spring rest length | 0.07785 m |
| Motor torque | 0.033 Nm |
| \(\beta_0\) | -0.0620 rad |
Detailed information about the mechanical structure of each body is reported in next tables, referred to the reference systems presented in the next figure.

| Rod Elements Properties | |||||
|---|---|---|---|---|---|
| Center of Mass (CoM) | Mass | Inertia (CoM) | Length | ||
| X [m] | Y [m] | [Kg] | [Kg \(m^2\)] | [m] | |
| OF | 0.00092 | 0.0 | 0.04325 | 2.194e-6 | 0.007 |
| FE | -0.0115 | 0.0 | 0.00365 | 4.410e-7 | 0.028 |
| EG | 0.0 | 0.01421 | 0.00706 | 5.667e-7 | 0.02 |
| AG | 0.02308 | 0.00916 | 0.0705 | 1.169e-5 | 0.04 |
| AH | -0.00449 | -0.01228 | 0.05498 | 1.912e-5 | 0.04 |
| HE | -0.01421 | 0.0 | 0.00706 | 5.667e-7 | 0.02 |
| Triangular Element Properties, points defined in \(X_{BDE}-Y_{BDE}\) SoR | ||
|---|---|---|
| Center of Mass (CoM) Coordinates | 0.01043 m (X) | -0.0187 m (Y) |
| Mass | 0.02372 Kg | |
| Inertia (CoM) | 5.255e-6 Kg \(m^2\) | |
| Point B Coordinates | 0 m (X) | 0 m (Y) |
| Point D Coordinates | 0.02 m (X) | -0.018 m (Y) |
| Point E Coordinates | 0 m (X) | -0.035 m (Y) |
| Points in ground X-Y SoR | ||
|---|---|---|
| Point | X [m] | Y [m] |
| O | 0.0 | 0.0 |
| A | -0.06934 | -0.00227 |
| B | 0.03635 | 0.03273 |
| C | 0.014 | 0.072 |
| Initial Joints Position | |
|---|---|
| Angle | Value [rad] |
| \(\beta\) | -0.0620 |
| \(\hat{OFE}\) | 0.0 |
| \(\hat{FEB}\) | 2.088 |
| \(\hat{FEG}\) | 2.341 |
| \(\hat{EGA}\) | 1.792 |
| \(\hat{EHA}\) | 1.348 |
Results
The dynamic simulation of the A03 benchmark was executed for 0.05 s. The starting position of the simulation is defined by the values reported in the last table.
The objective of the simulation is to measure the sytem total energy balance running the simulation in the minimum CPU time. The energy provided to the system by the driving torque is given by:
\(E - E_0 = \tau ( \beta - \beta_0)\)
where the pedix 0 indicate the initial condition and E is the mechanical energy of the system.
According to this formulation, the total energy balance can be written as:
\(\Delta U = T + V - E_0 - \tau(\beta - \beta_0)\)
where T is the kinetic energy and V the potential energy.
Since no dissipation is present in the mechanism theoretical value for \(\Delta U\) is zero.
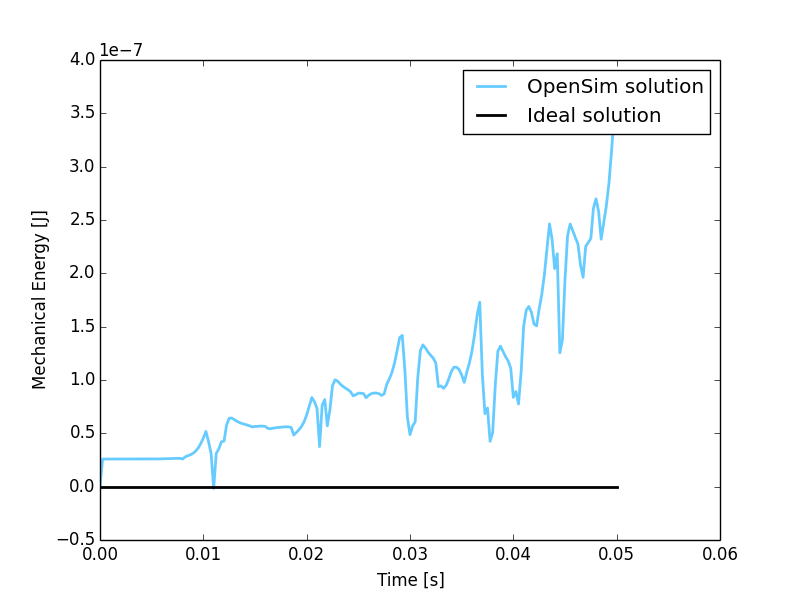
Figure 9: Total energy variation during simulation period from the initial condition. Theoretical variation (black line) and simulated one (blue line).
A second evaluation has been conducted measuring F point displacements and comparing them with the reference solution. The simulation with OpenSim perfectly match the reference values as shown in the next figure.
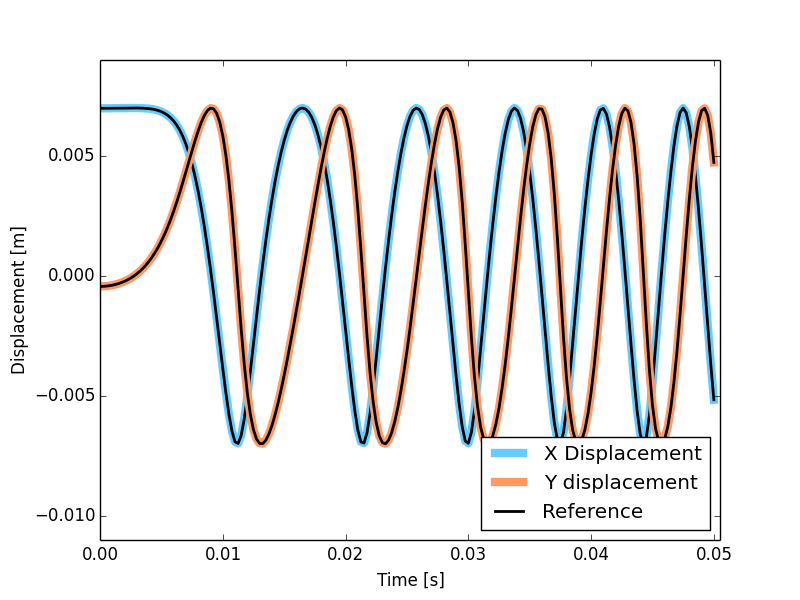
Figure 10: Comparison of the point F displacement between Andrew’s mechanism model simulated in OpenSim (colored lines) and MBS benchmark reference values (black dashed lines).
Computational Performances
To compute the simulation the developed implementation required 0.384 seconds.
Results obtained using an Intel Core i5-4570 @ 3.2 GHz computer running Windows 8.1 64-bit. OpenSim official release used: 3.2.
Comparision with other dynamic engines has been conducted submitting the obtained results to the benchmark collaborative library. Click here gto see the comparison results.
Videos
Download
- Andrew’s squeezing mechanism on MBS Benchmark library available at: http://goo.gl/cU4fPg
- OpenSim implementation available at: http://goo.gl/R9tl3z
- Videos of Andrew’s squeezing mechanism simulated in OpenSim available at: https://youtu.be/XOgsQz5iabs